Hi there! I’m Eve
Science first made sense to me when I could see it.
During my training in biomedical sciences (BHSc Hon), diagrams and visual models became essential for understanding complex biology. Molecular pathways, cellular systems, and experimental methods became clearer when they were translated into images. Over time, creating visuals became more than a way to study; it became a way to think about science.
My background in wet-lab research at the University of Calgary, studying stem cell signaling and immune responses in inflammatory bowel disease, shaped how I approach visual communication. Working closely with researchers showed me how often important discoveries remain difficult to interpret without clear visuals.
Today, I work as a medical illustrator and science communicator, collaborating with researchers and institutions to transform complex biology into visual stories that make science easier to understand.
Published in…
-
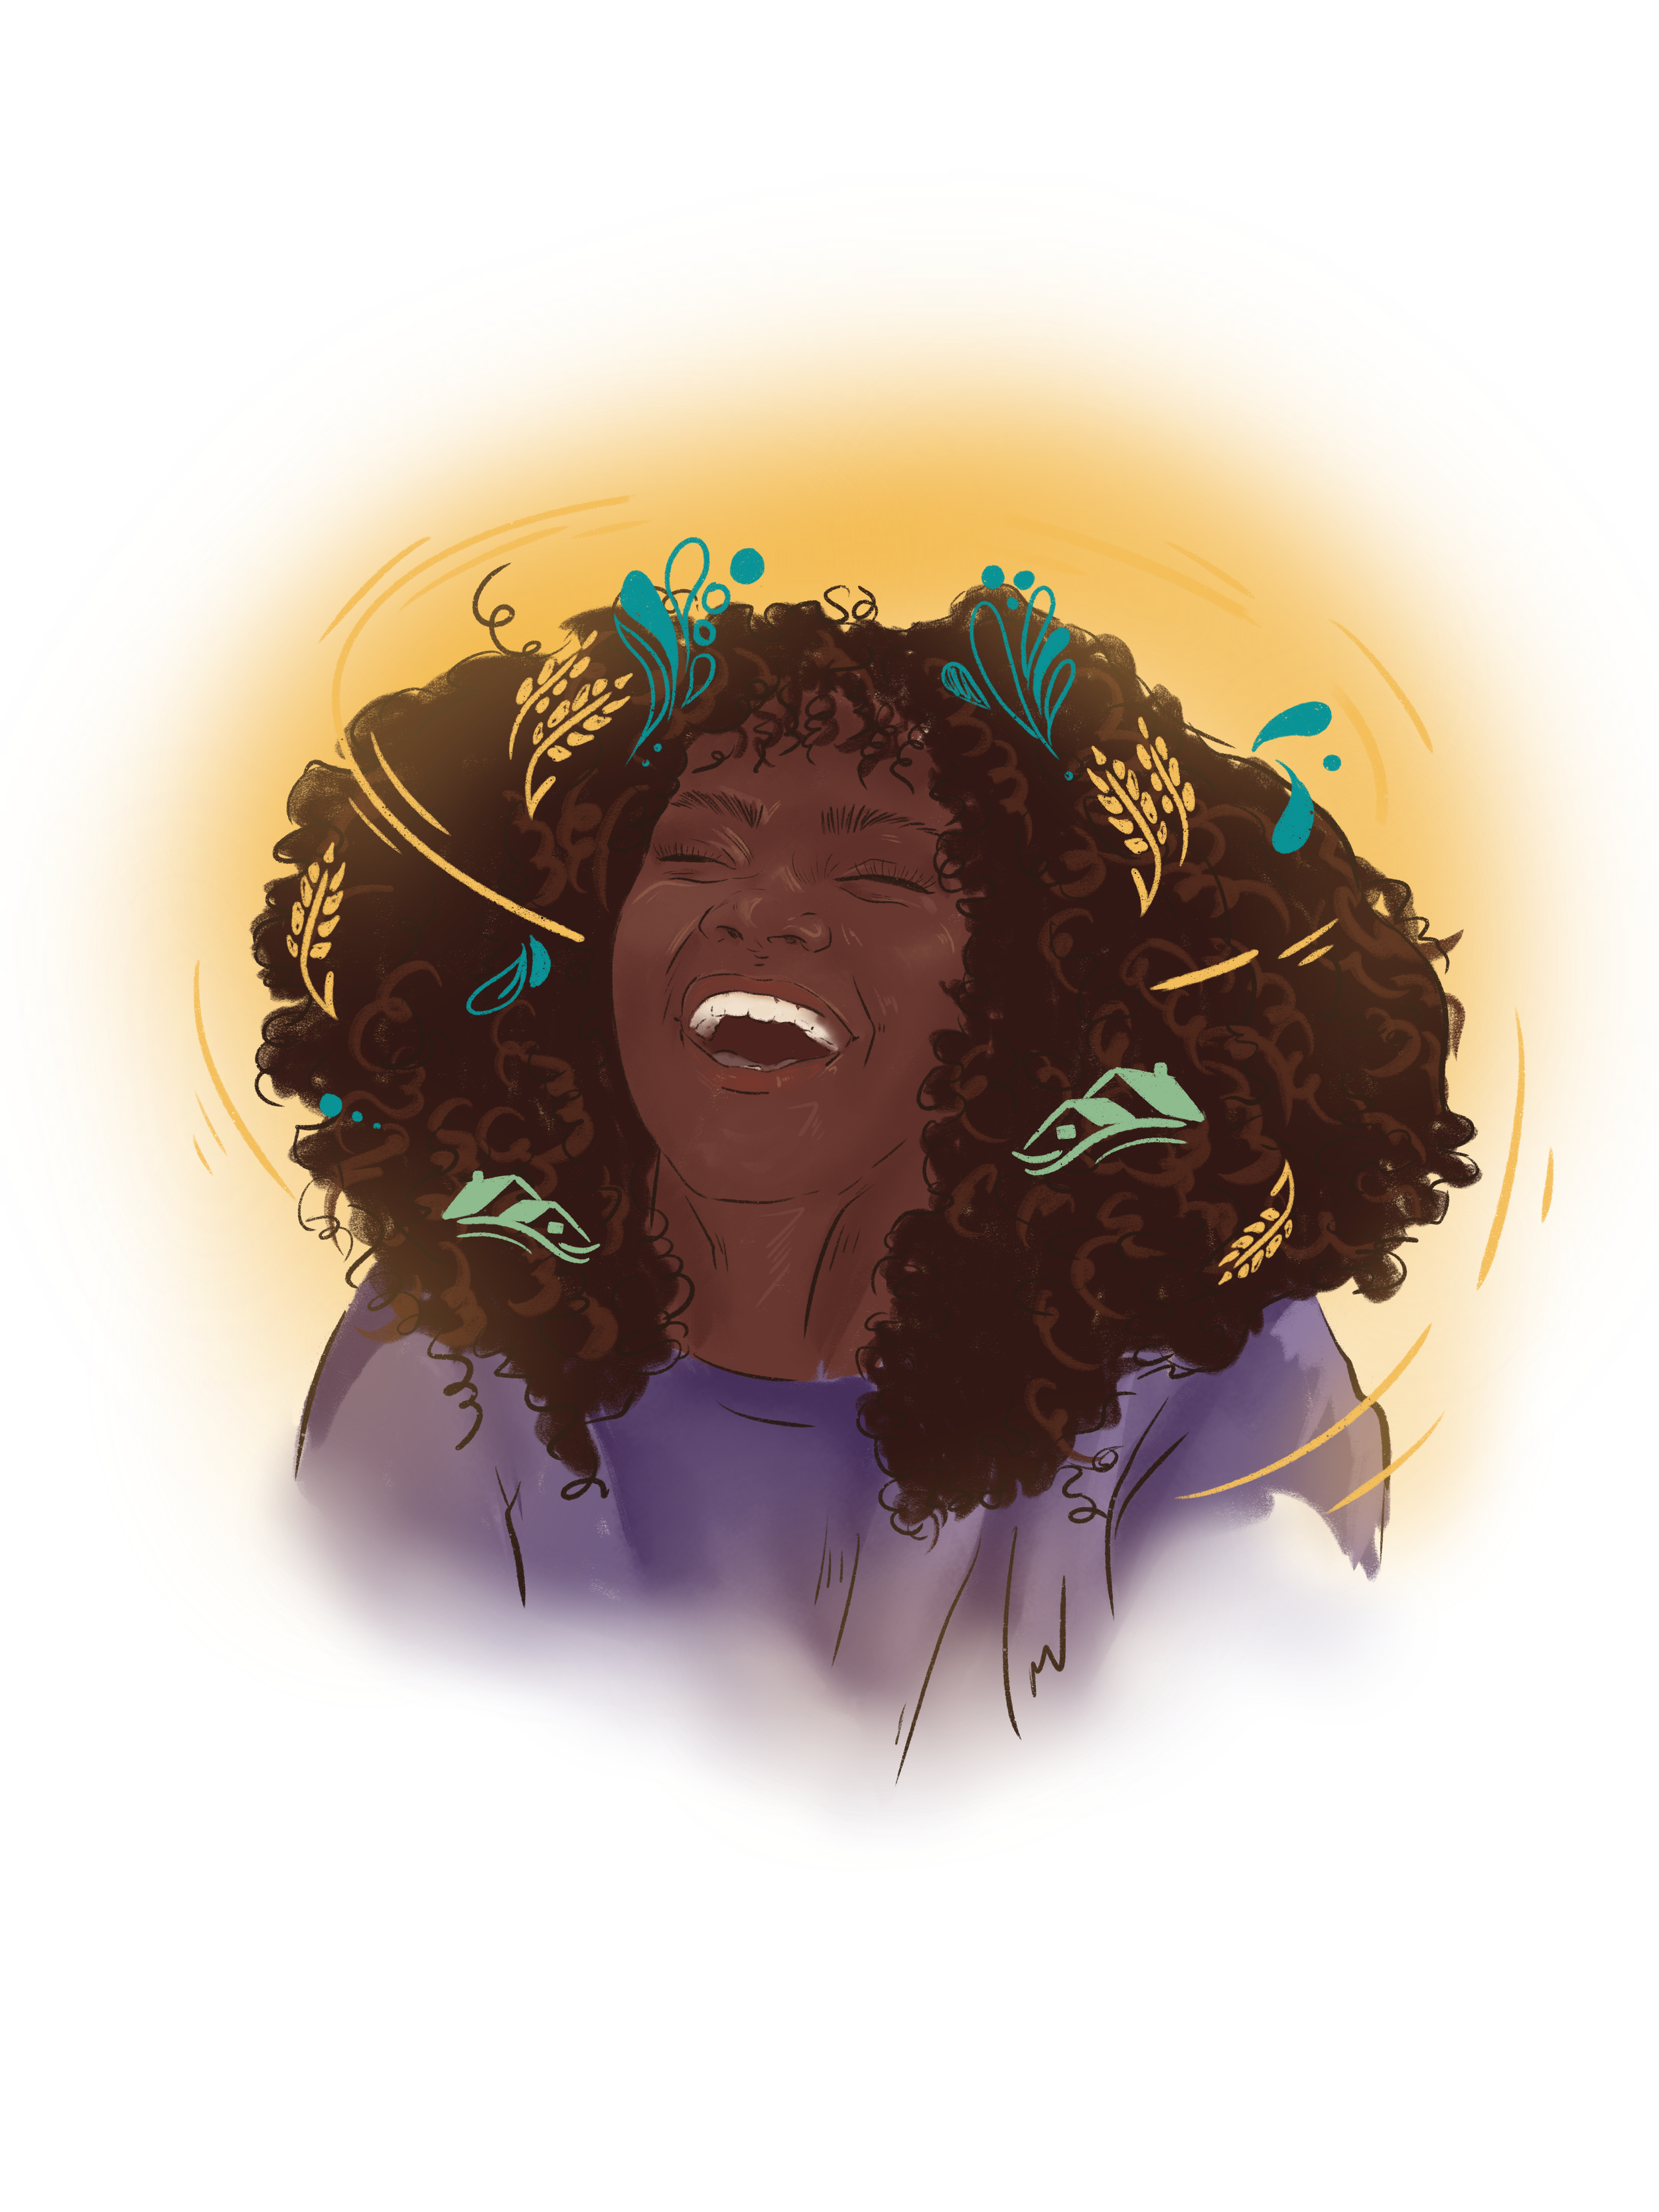
All Our Families Workbook
This collection of 12 hand-drawn illustrations celebrates mothers and families, highlighting resilience and growth. Each piece honors strength, care, and the lasting spirit of family, perfect for projects on wellbeing, empowerment, and community.
-

Cell Death & Disease
A graphical abstract, showing how GPx1 deficiency in macrophages from active Crohn’s disease patients weakens antioxidant defense, boosting lipid peroxidation and ferroptosis. Ensuring clarity and scientific accuracy for clinicians and researchers.
-
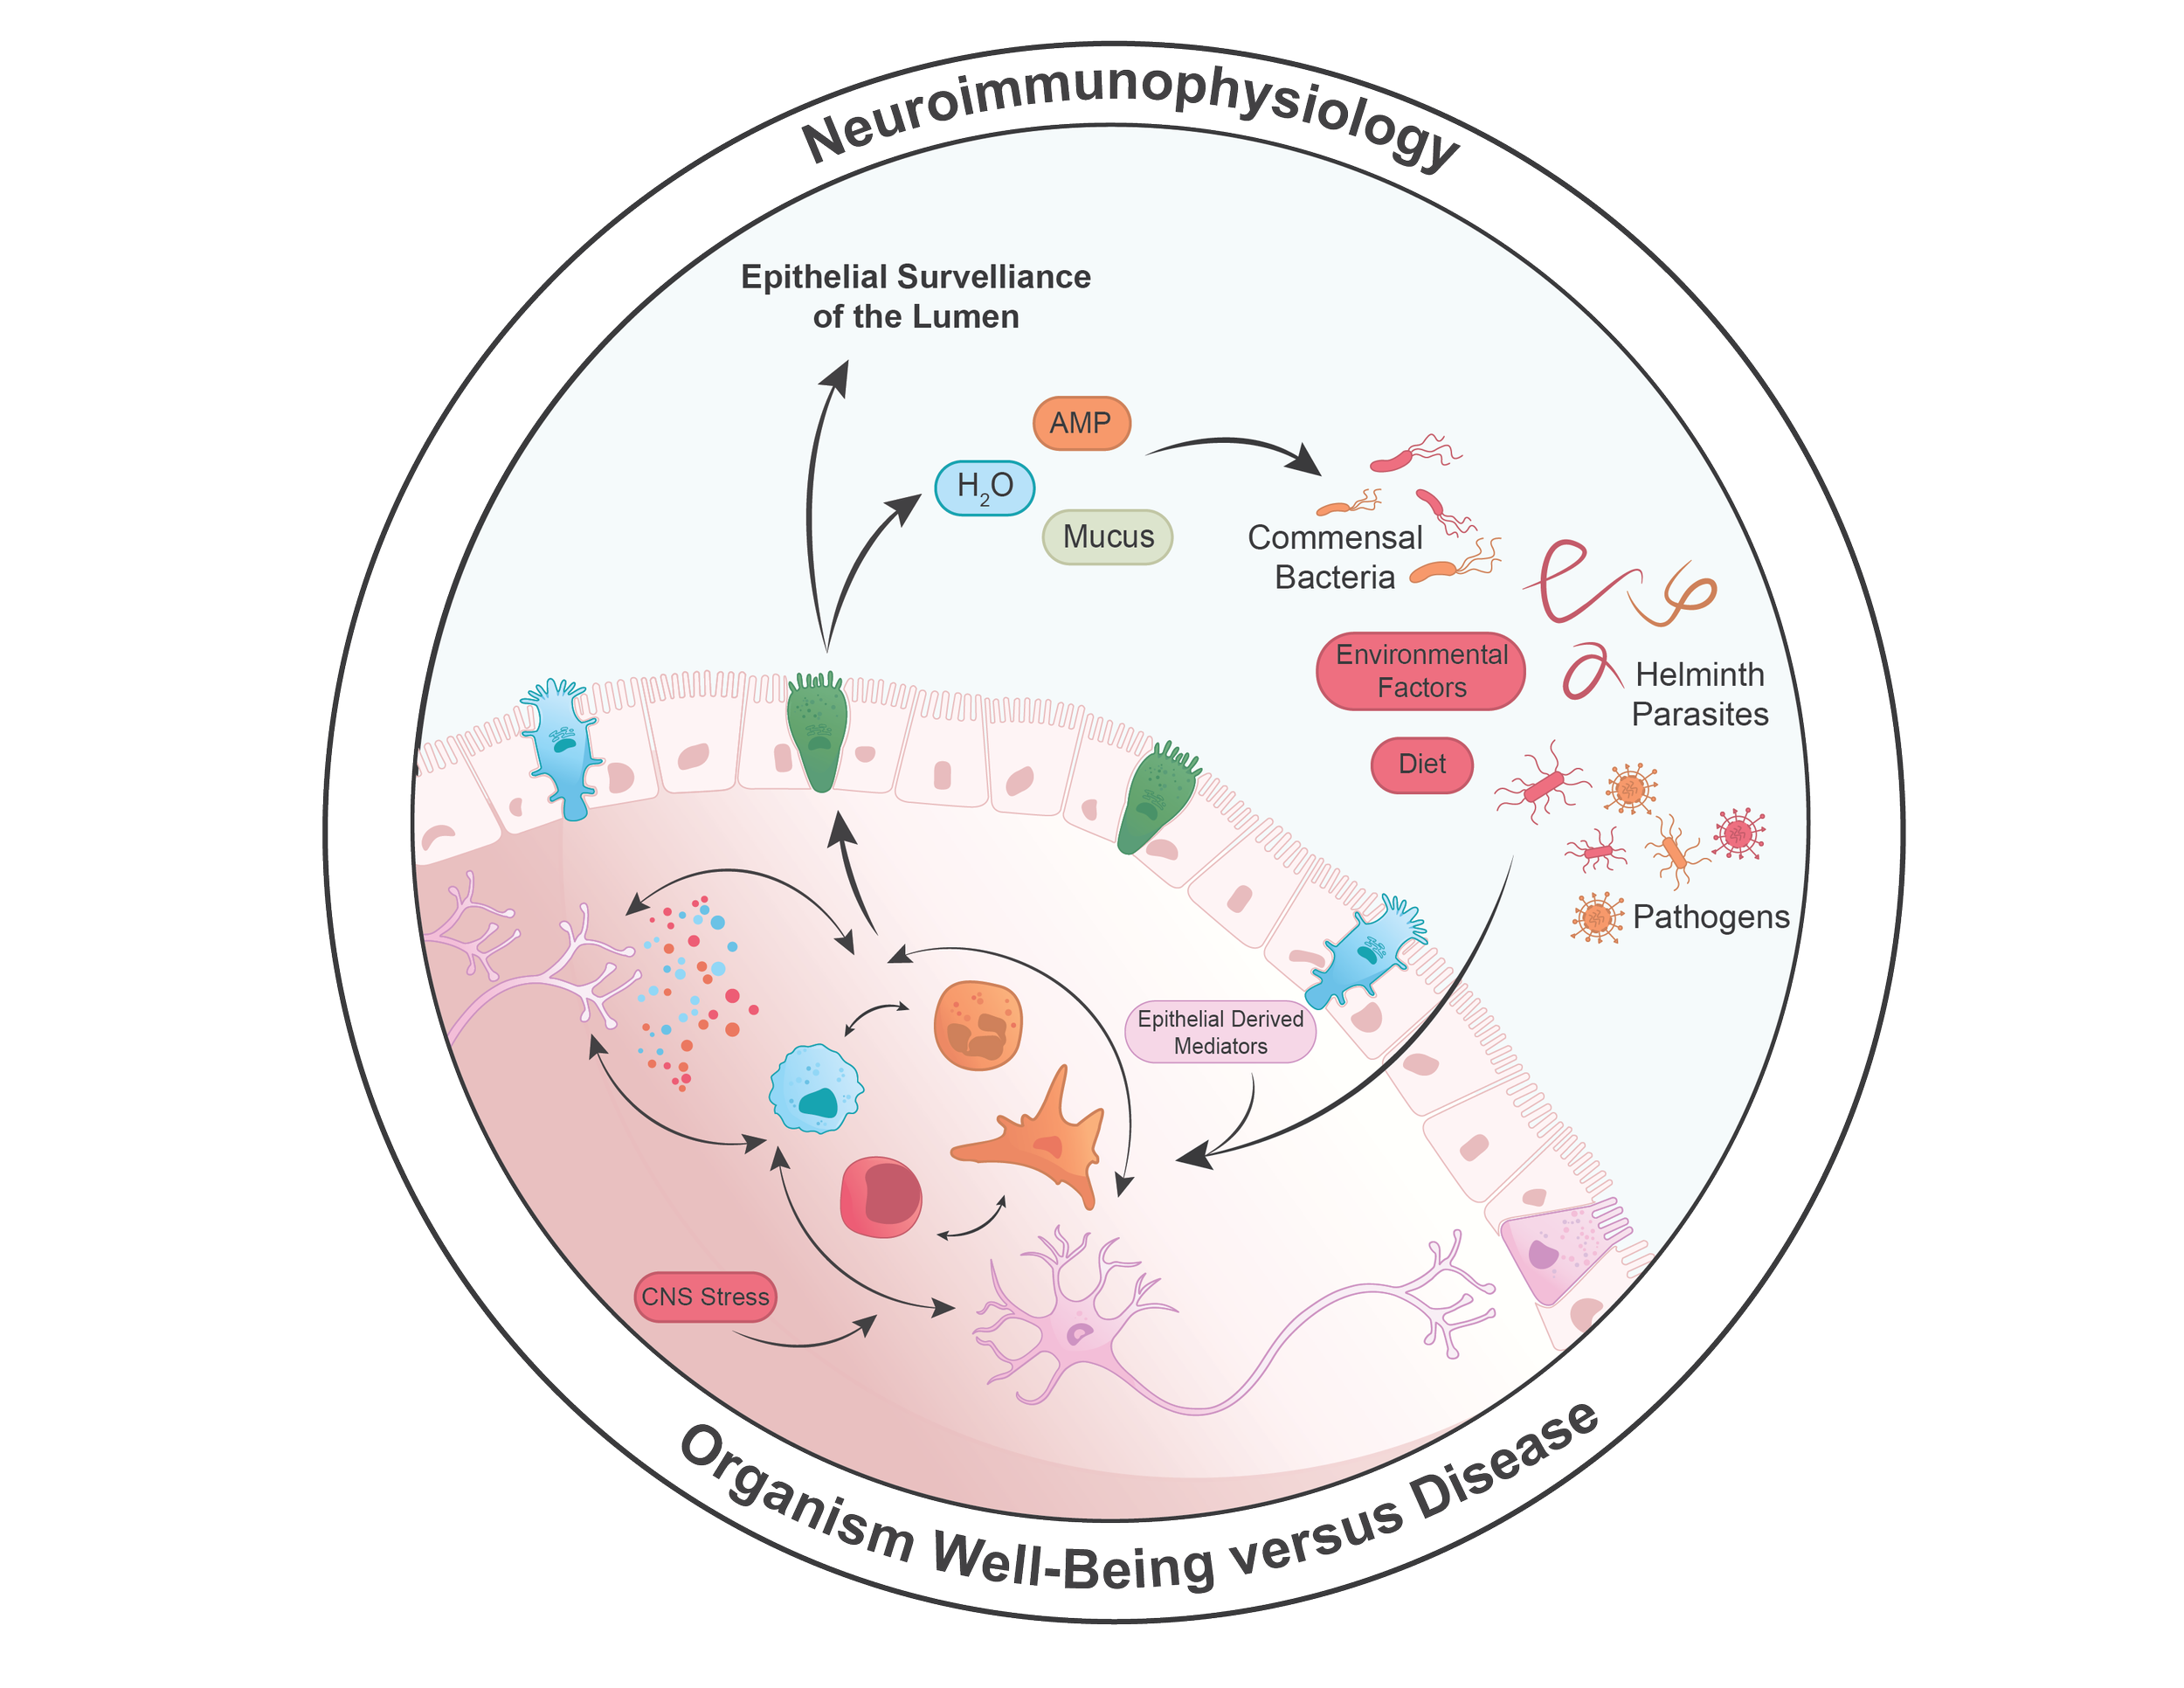
American Journal of Physiology-Gastrointestinal and Liver Physiology
This graphical abstract illustrates the intricate neuroimmunophysiology of the gastrointestinal tract, highlighting the dynamic interplay between the enteric nervous system, immune cells, and the gut epithelium.
-
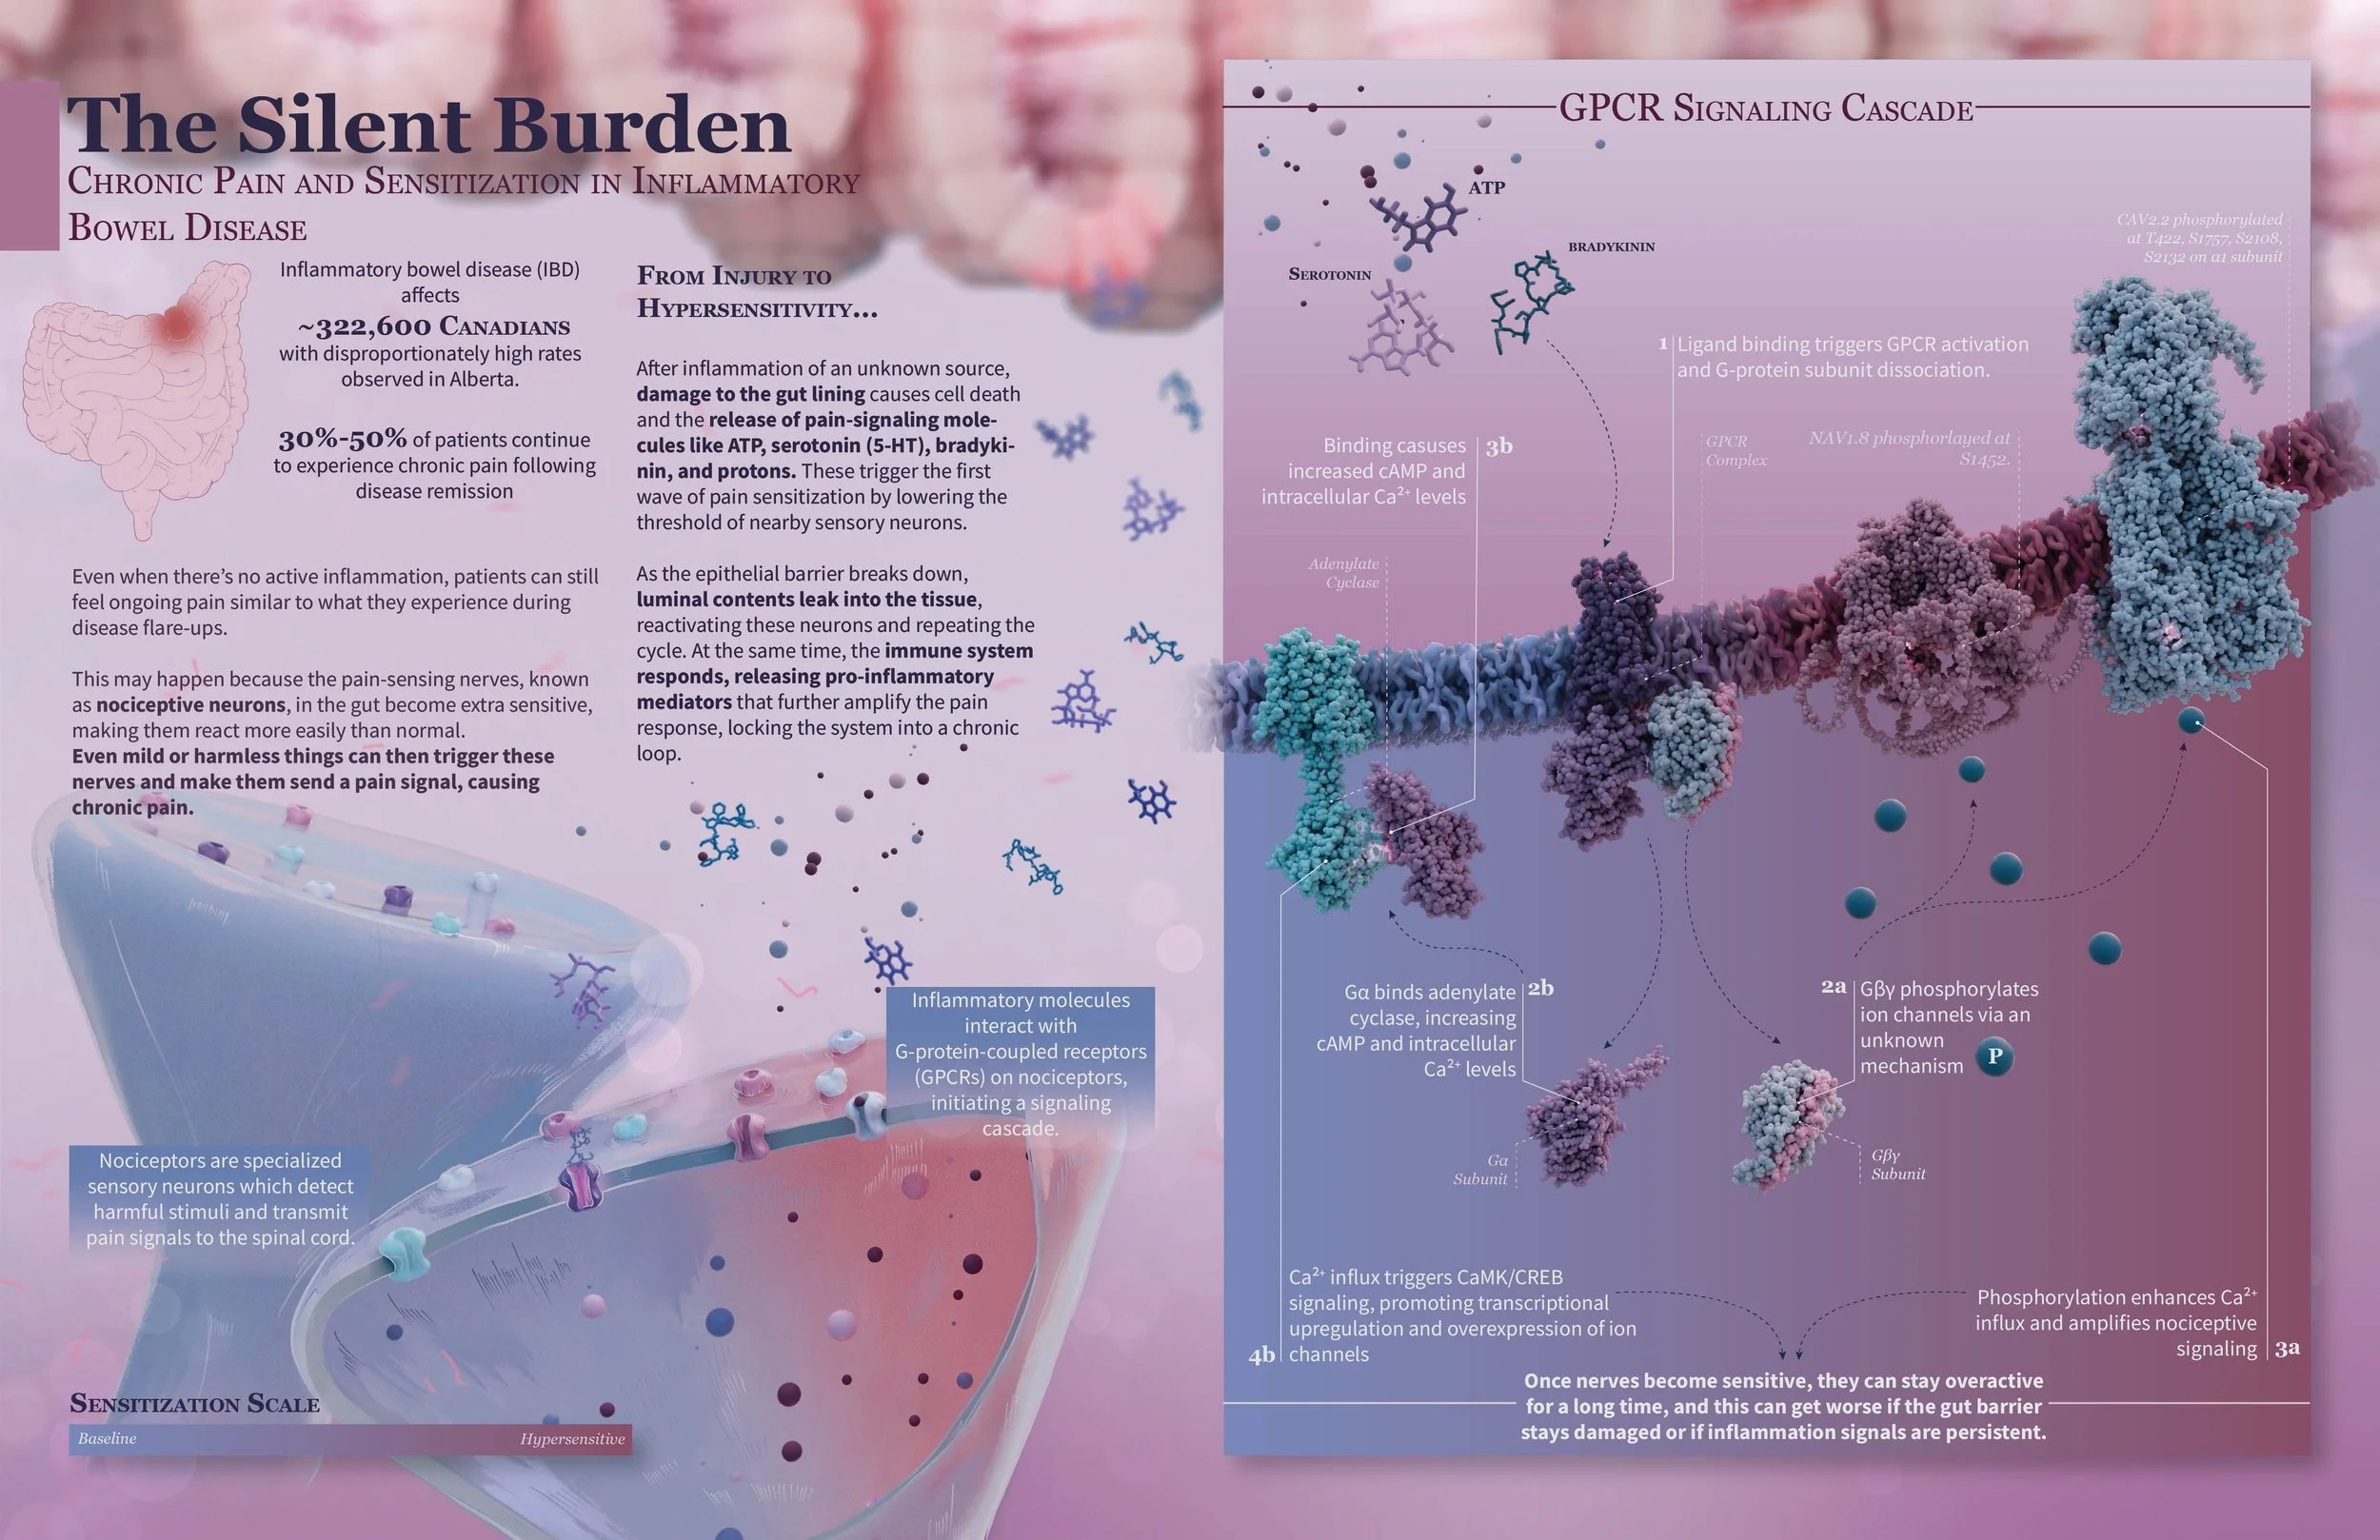
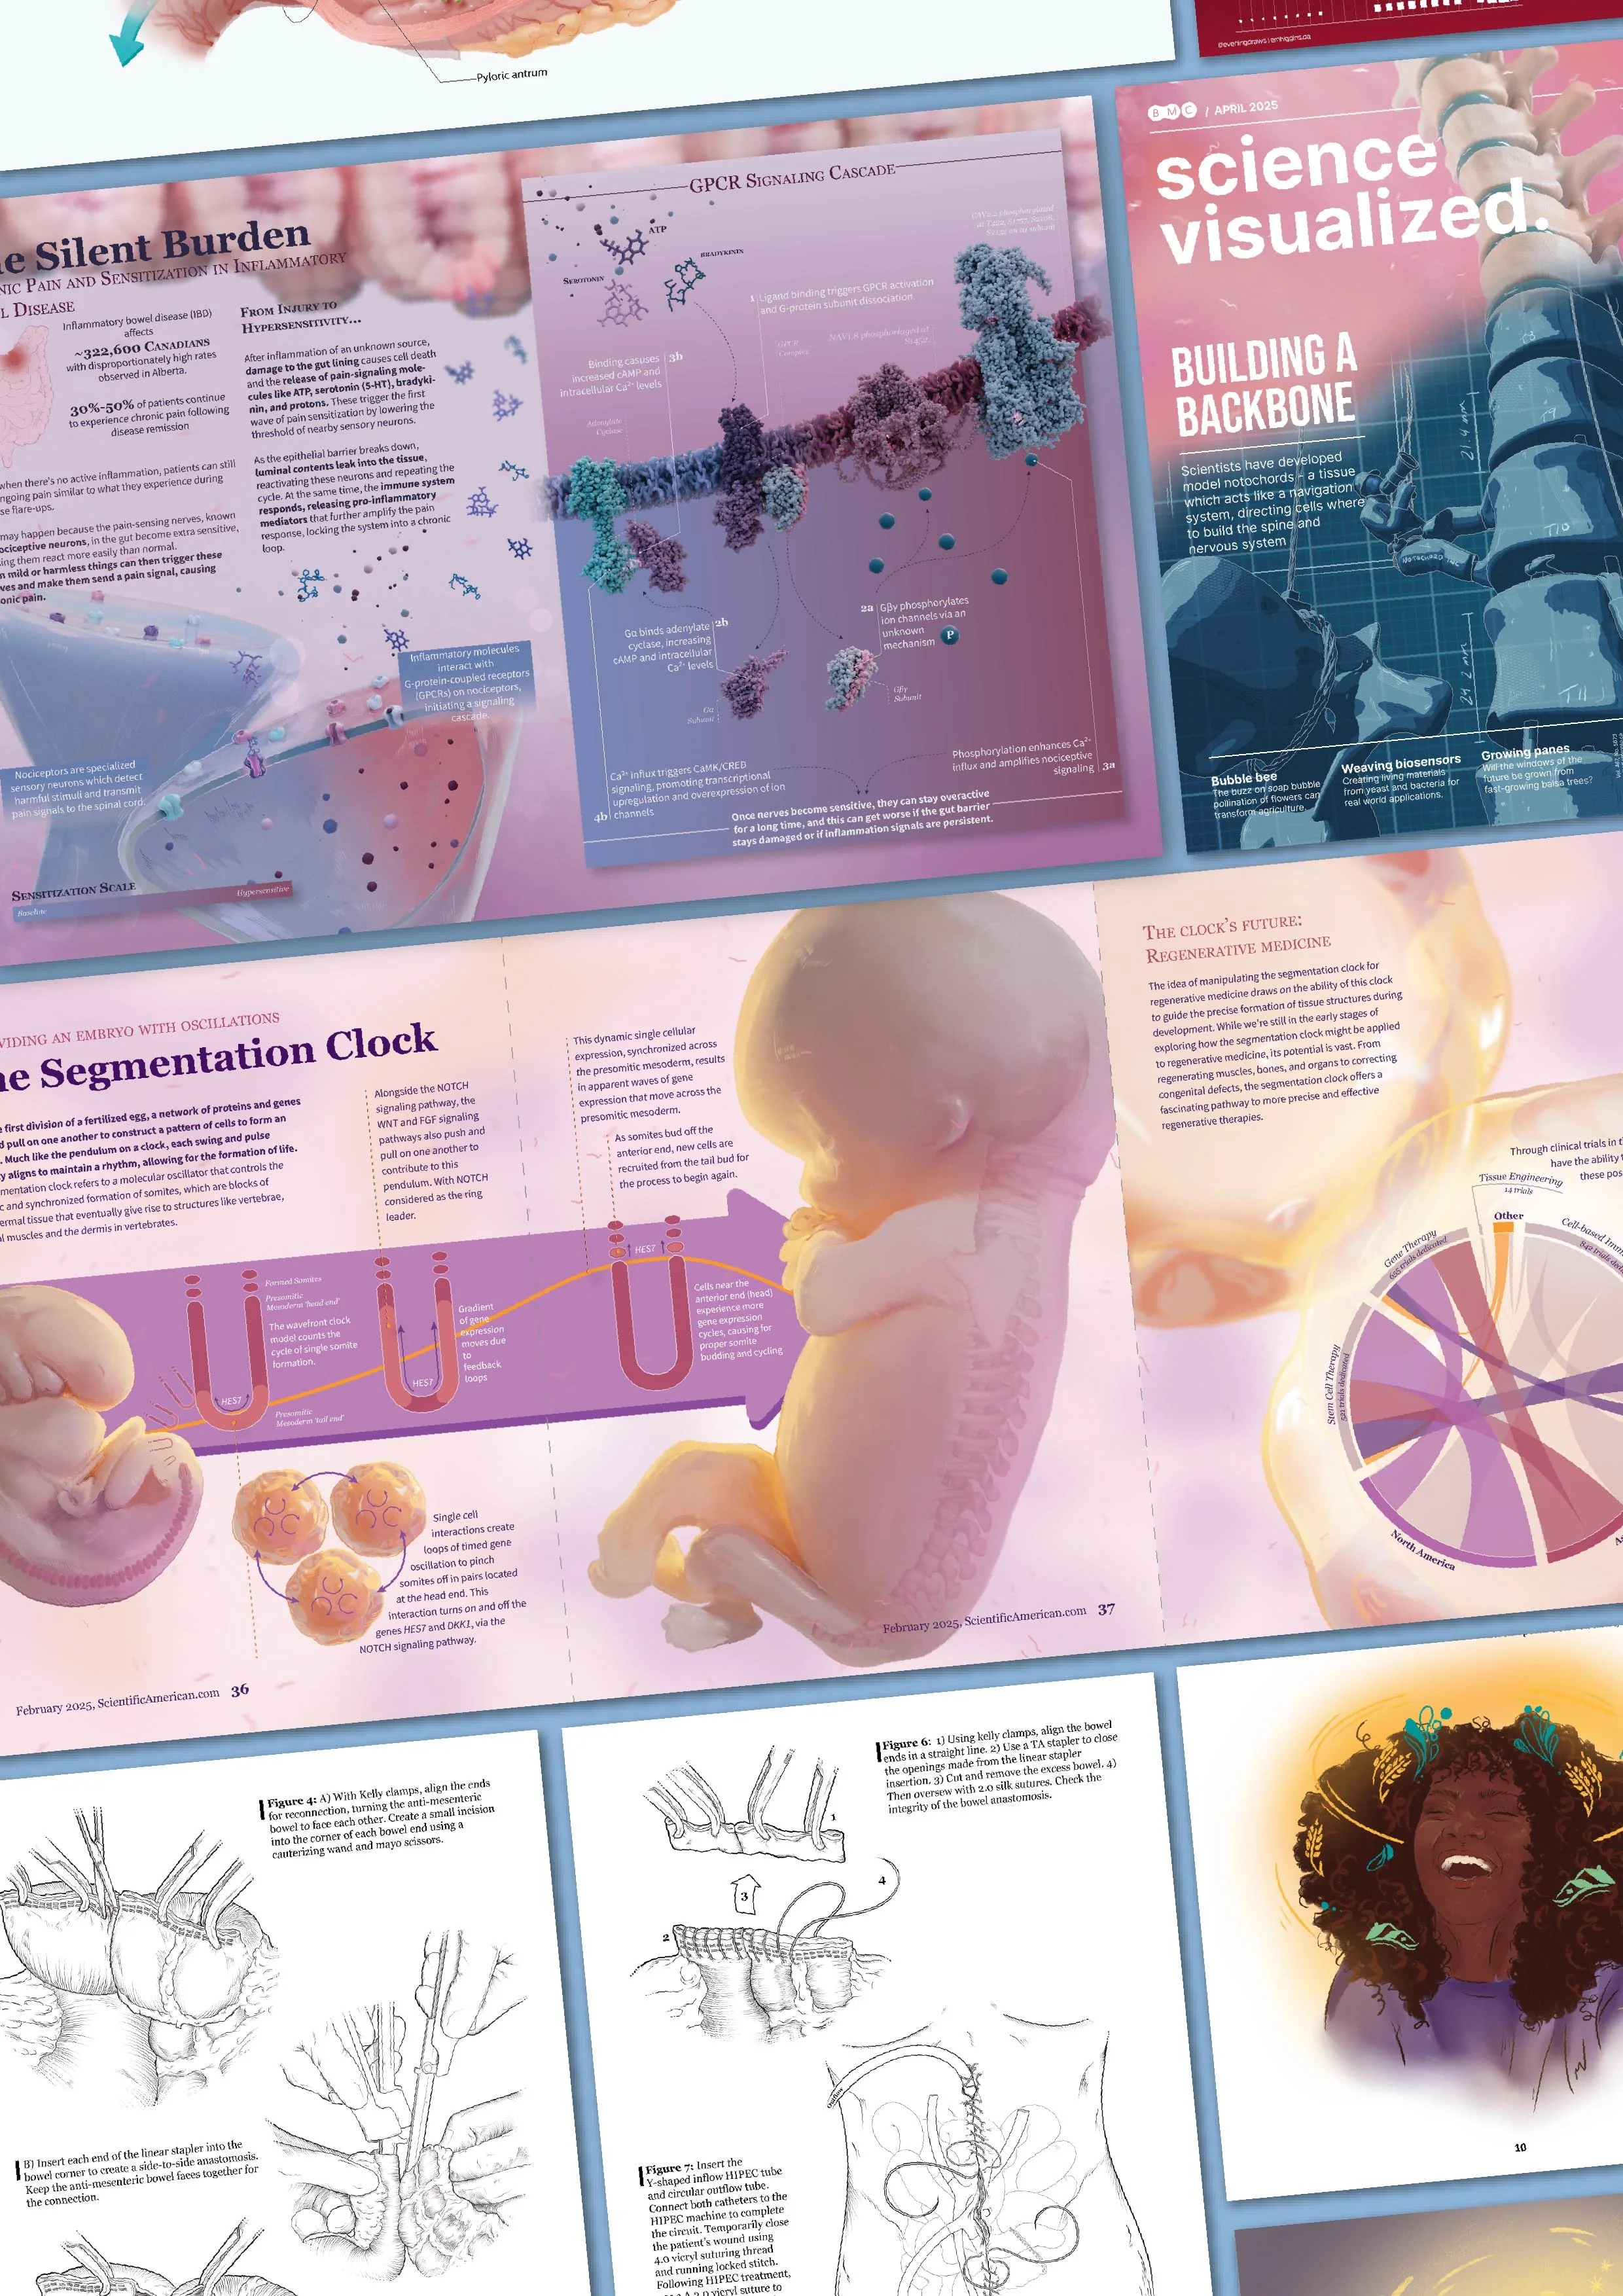
IMS Magazine - Health in the Margins
A clear, two-page spread designed for lay readers that explains inflammatory bowel disease (IBD) and the biological mechanisms behind its chronic pain.