Bringing Science to life.
Illustrating the stories that make medicine and science accessible to all.
Bridging the gap between data and understanding through scientifically grounded design and storytelling. Make your science seen, understood, and remembered.
Data Visualization
|
Scientific Illustration
|
Animation
|
Editorial Design
|
Graphical Abstracts
|
Data Visualization | Scientific Illustration | Animation | Editorial Design | Graphical Abstracts |
Case Studies…
Learn more about my process and research stages

More Stories…
From data visualization to patient education, science can be translated in a number of different ways to fit the audience
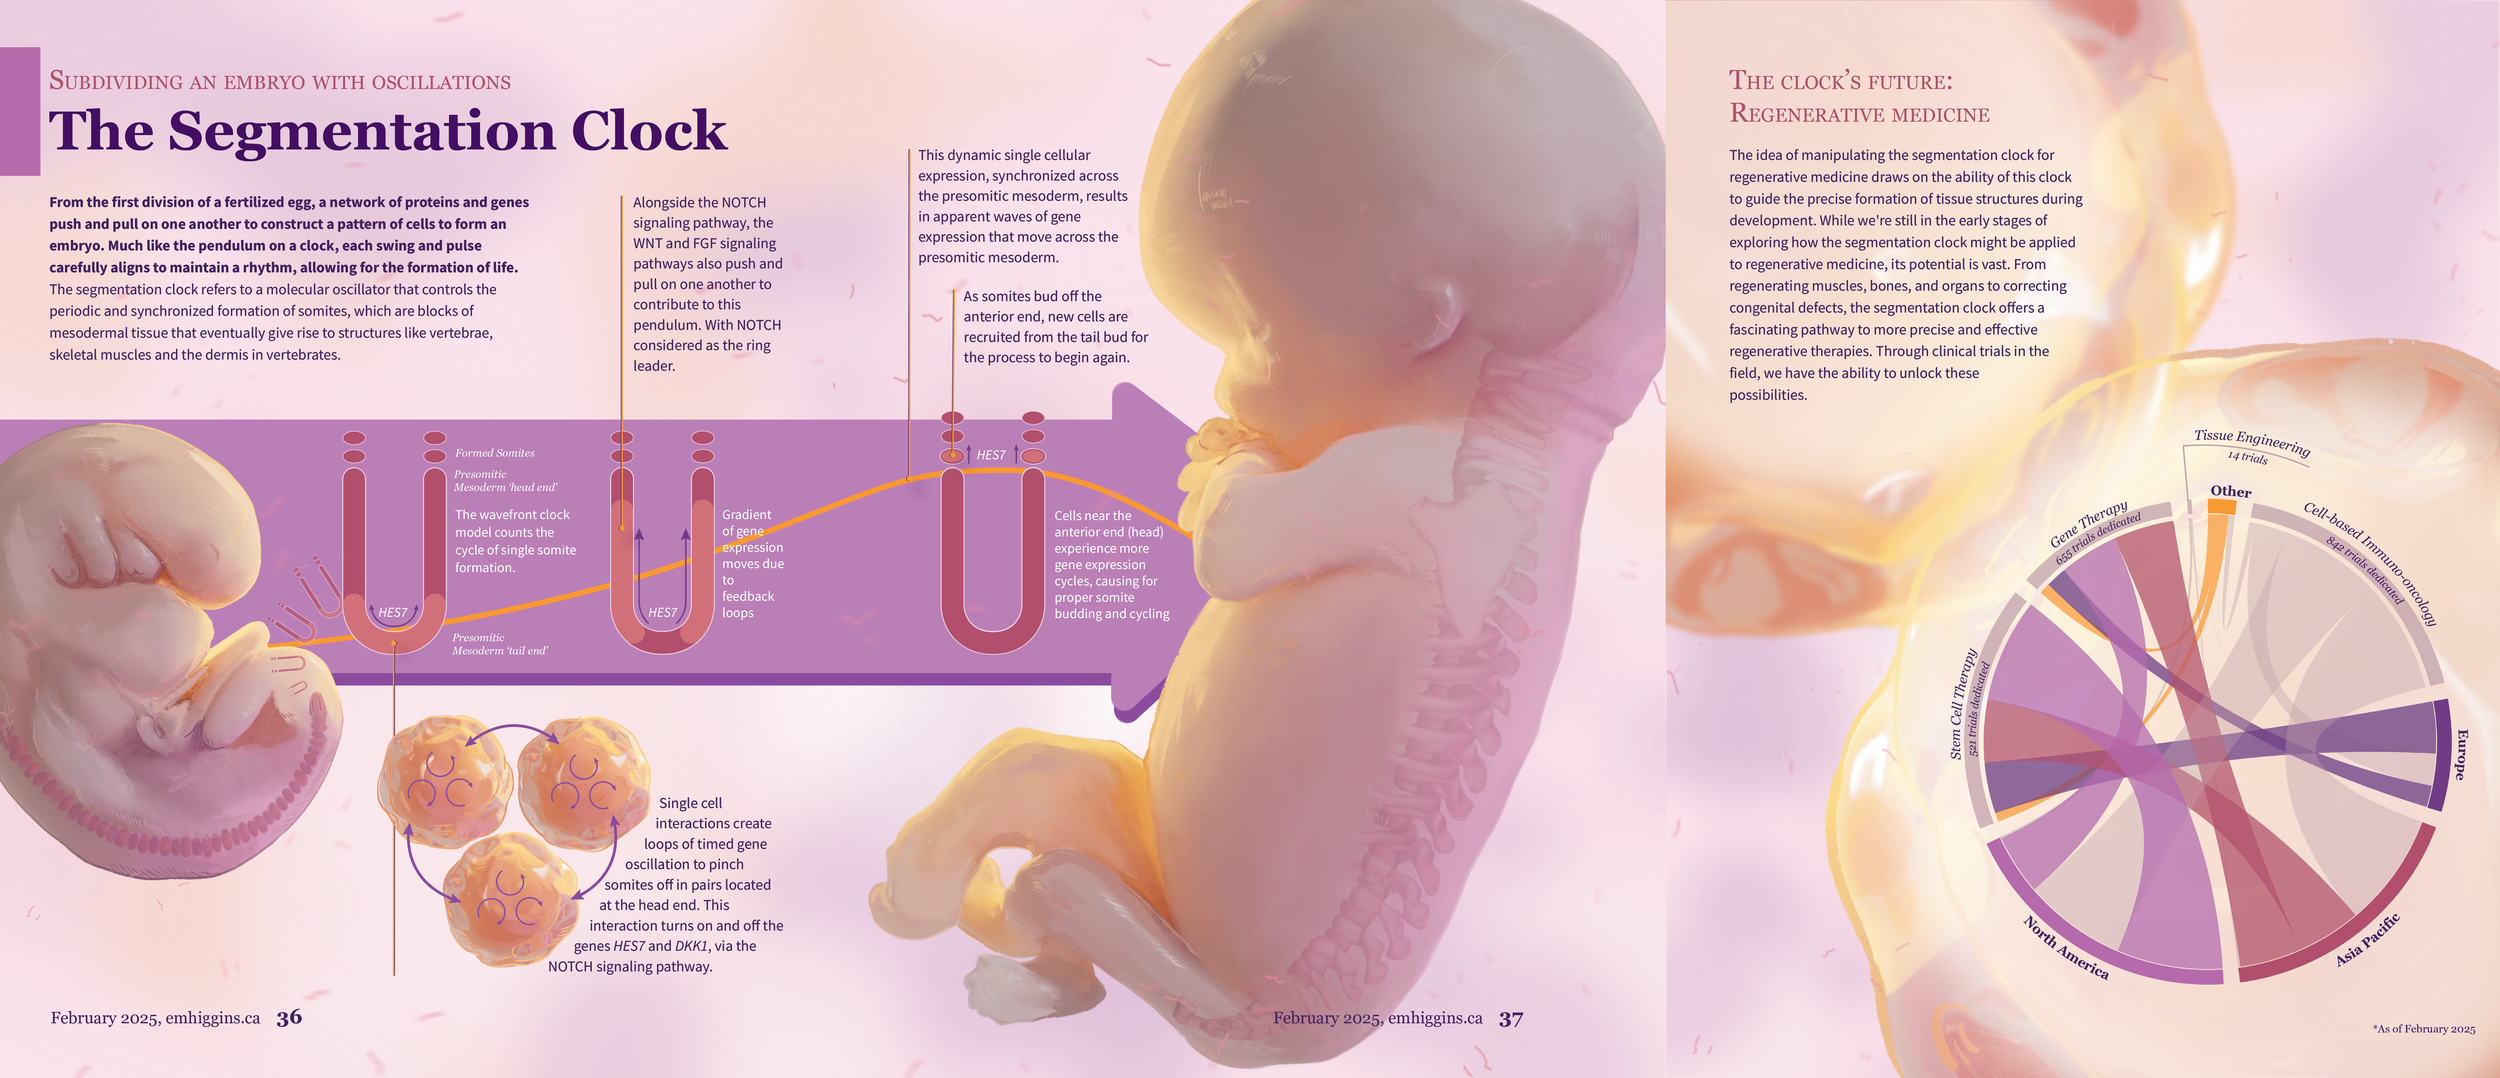
The Segmentation Clock

Biochemistry and Molecular Biology Logo - Graduate Student Association

25 Years on the Fast Track - A Data Visulization

All Our Families Workbook

GPx1 deficiency - Graphical abstract for Sousa et al.
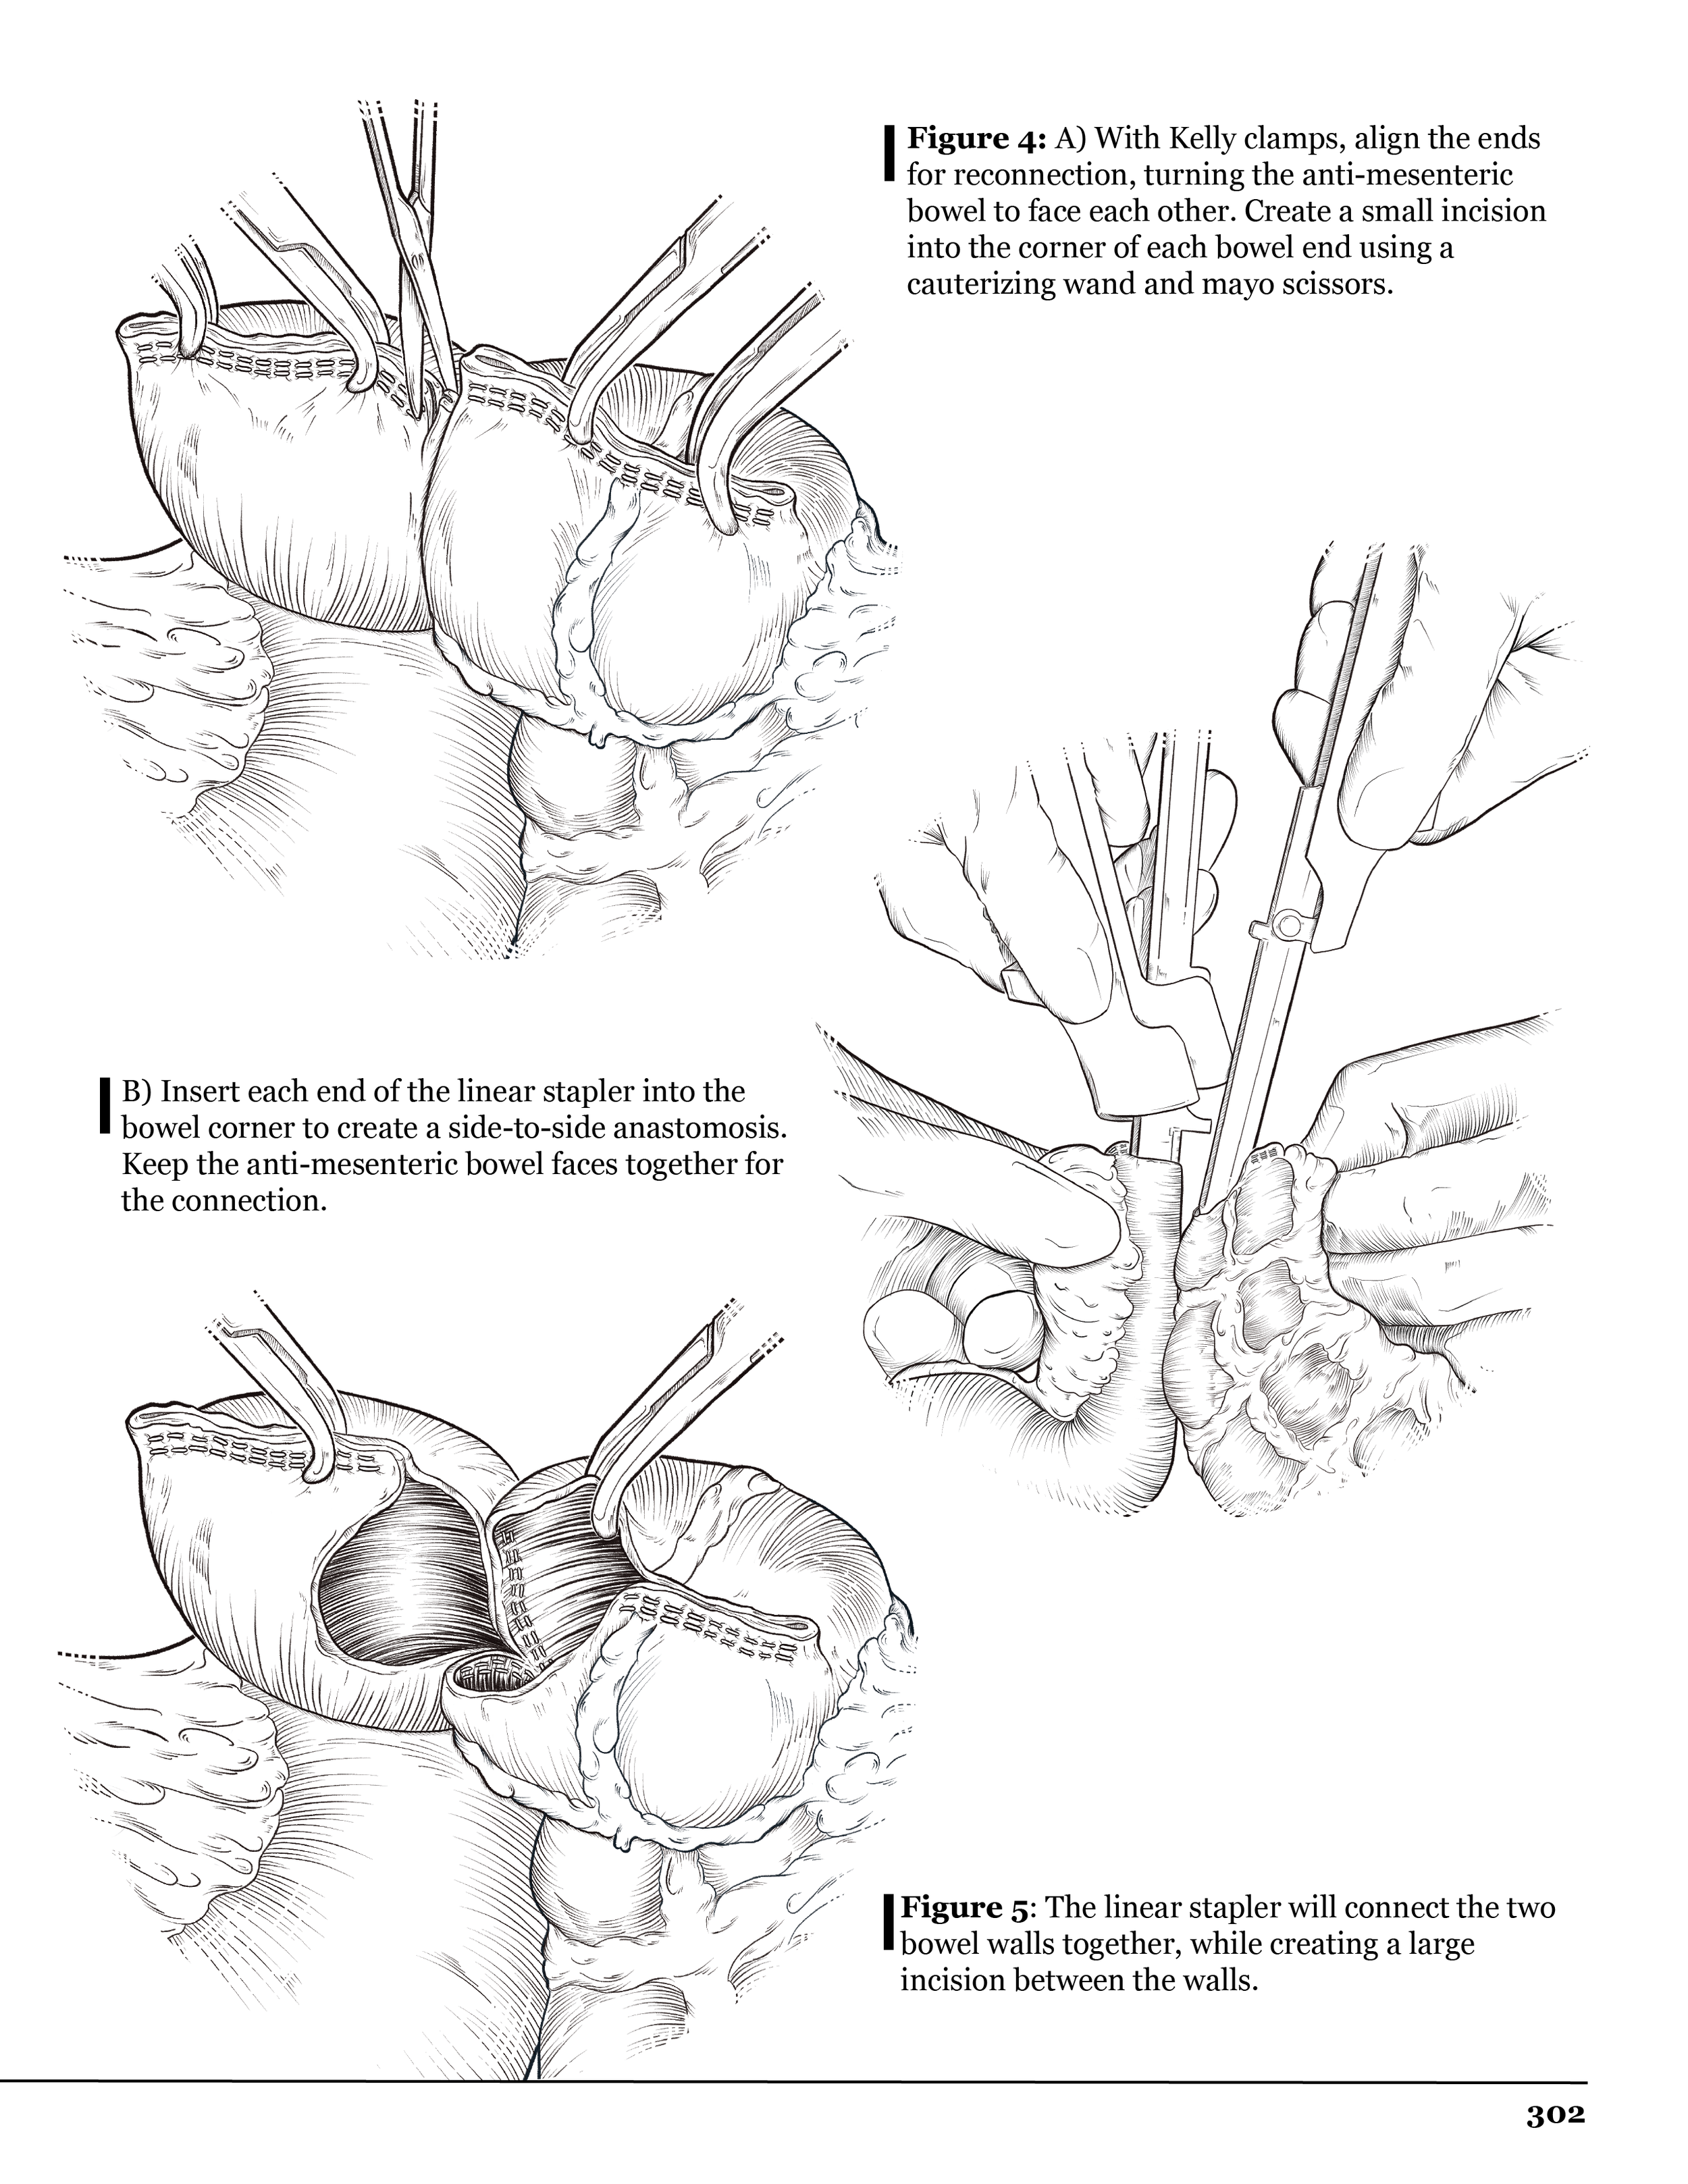
Surgical Sequence 1
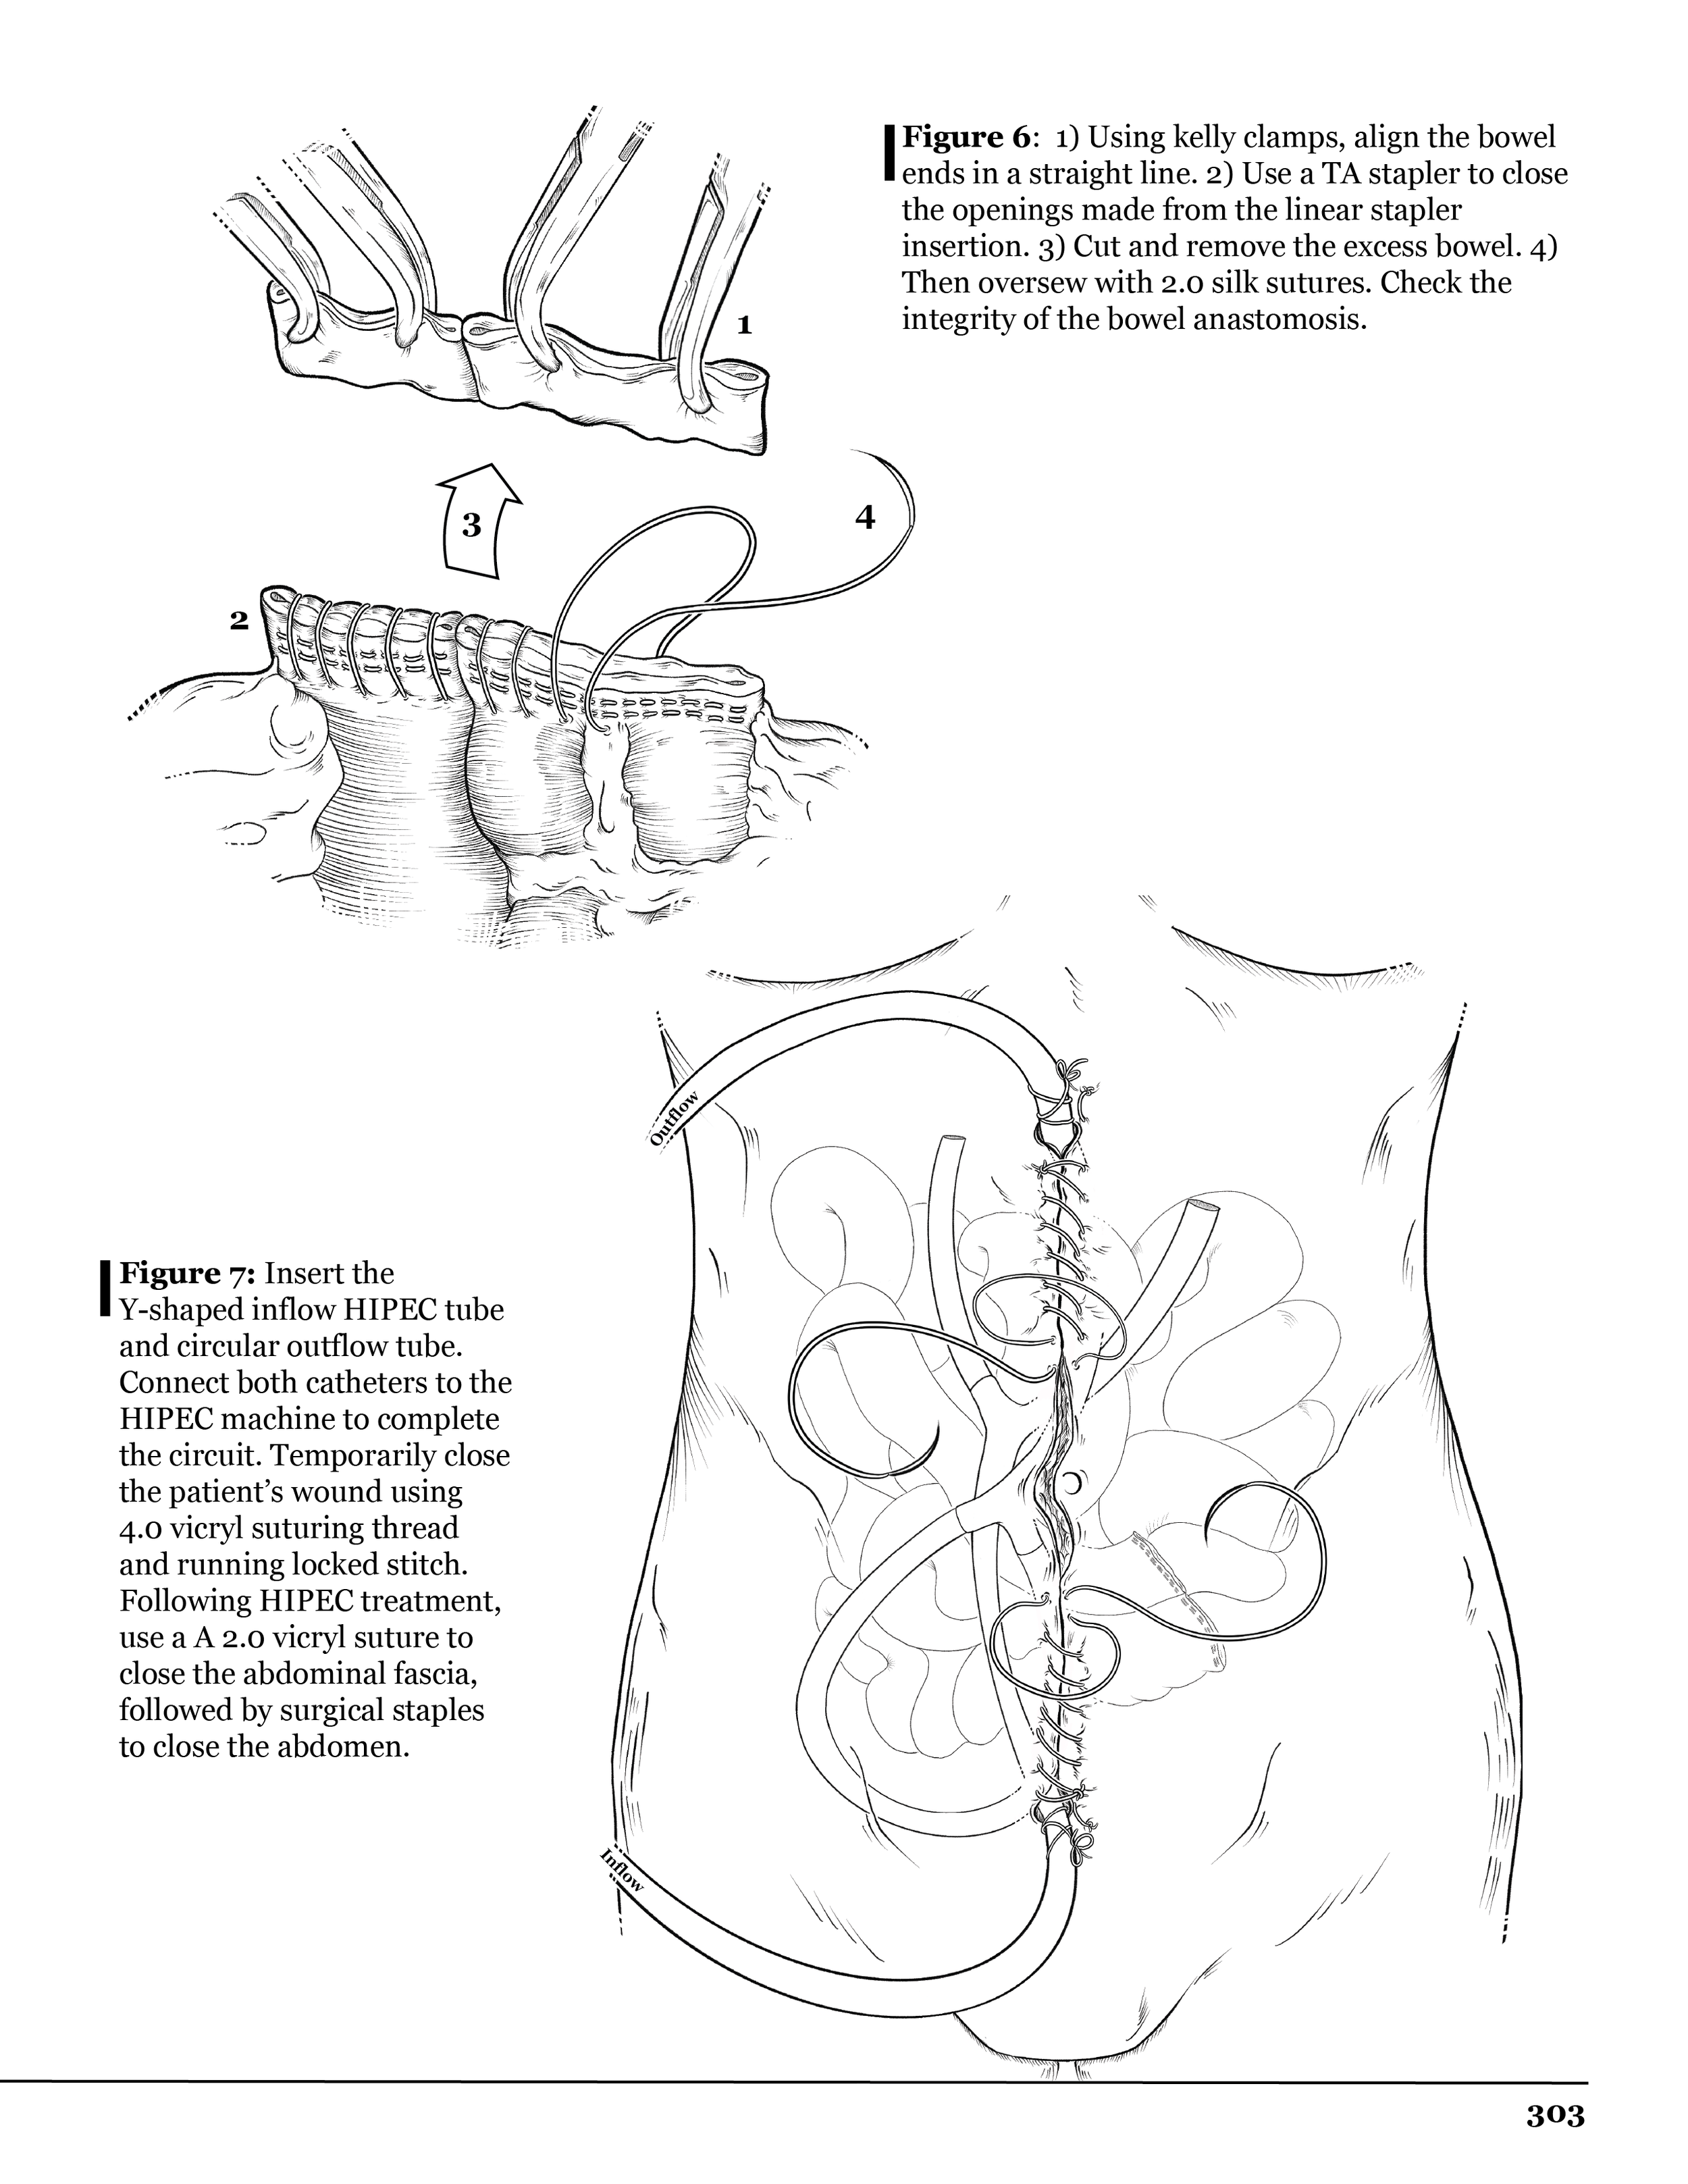
Surgical Sequence 2

Biochemistry and Molecular Biology Embroidery Logo - Graduate Student Association

Indole 3-Propionic Acid Molecular Visualization
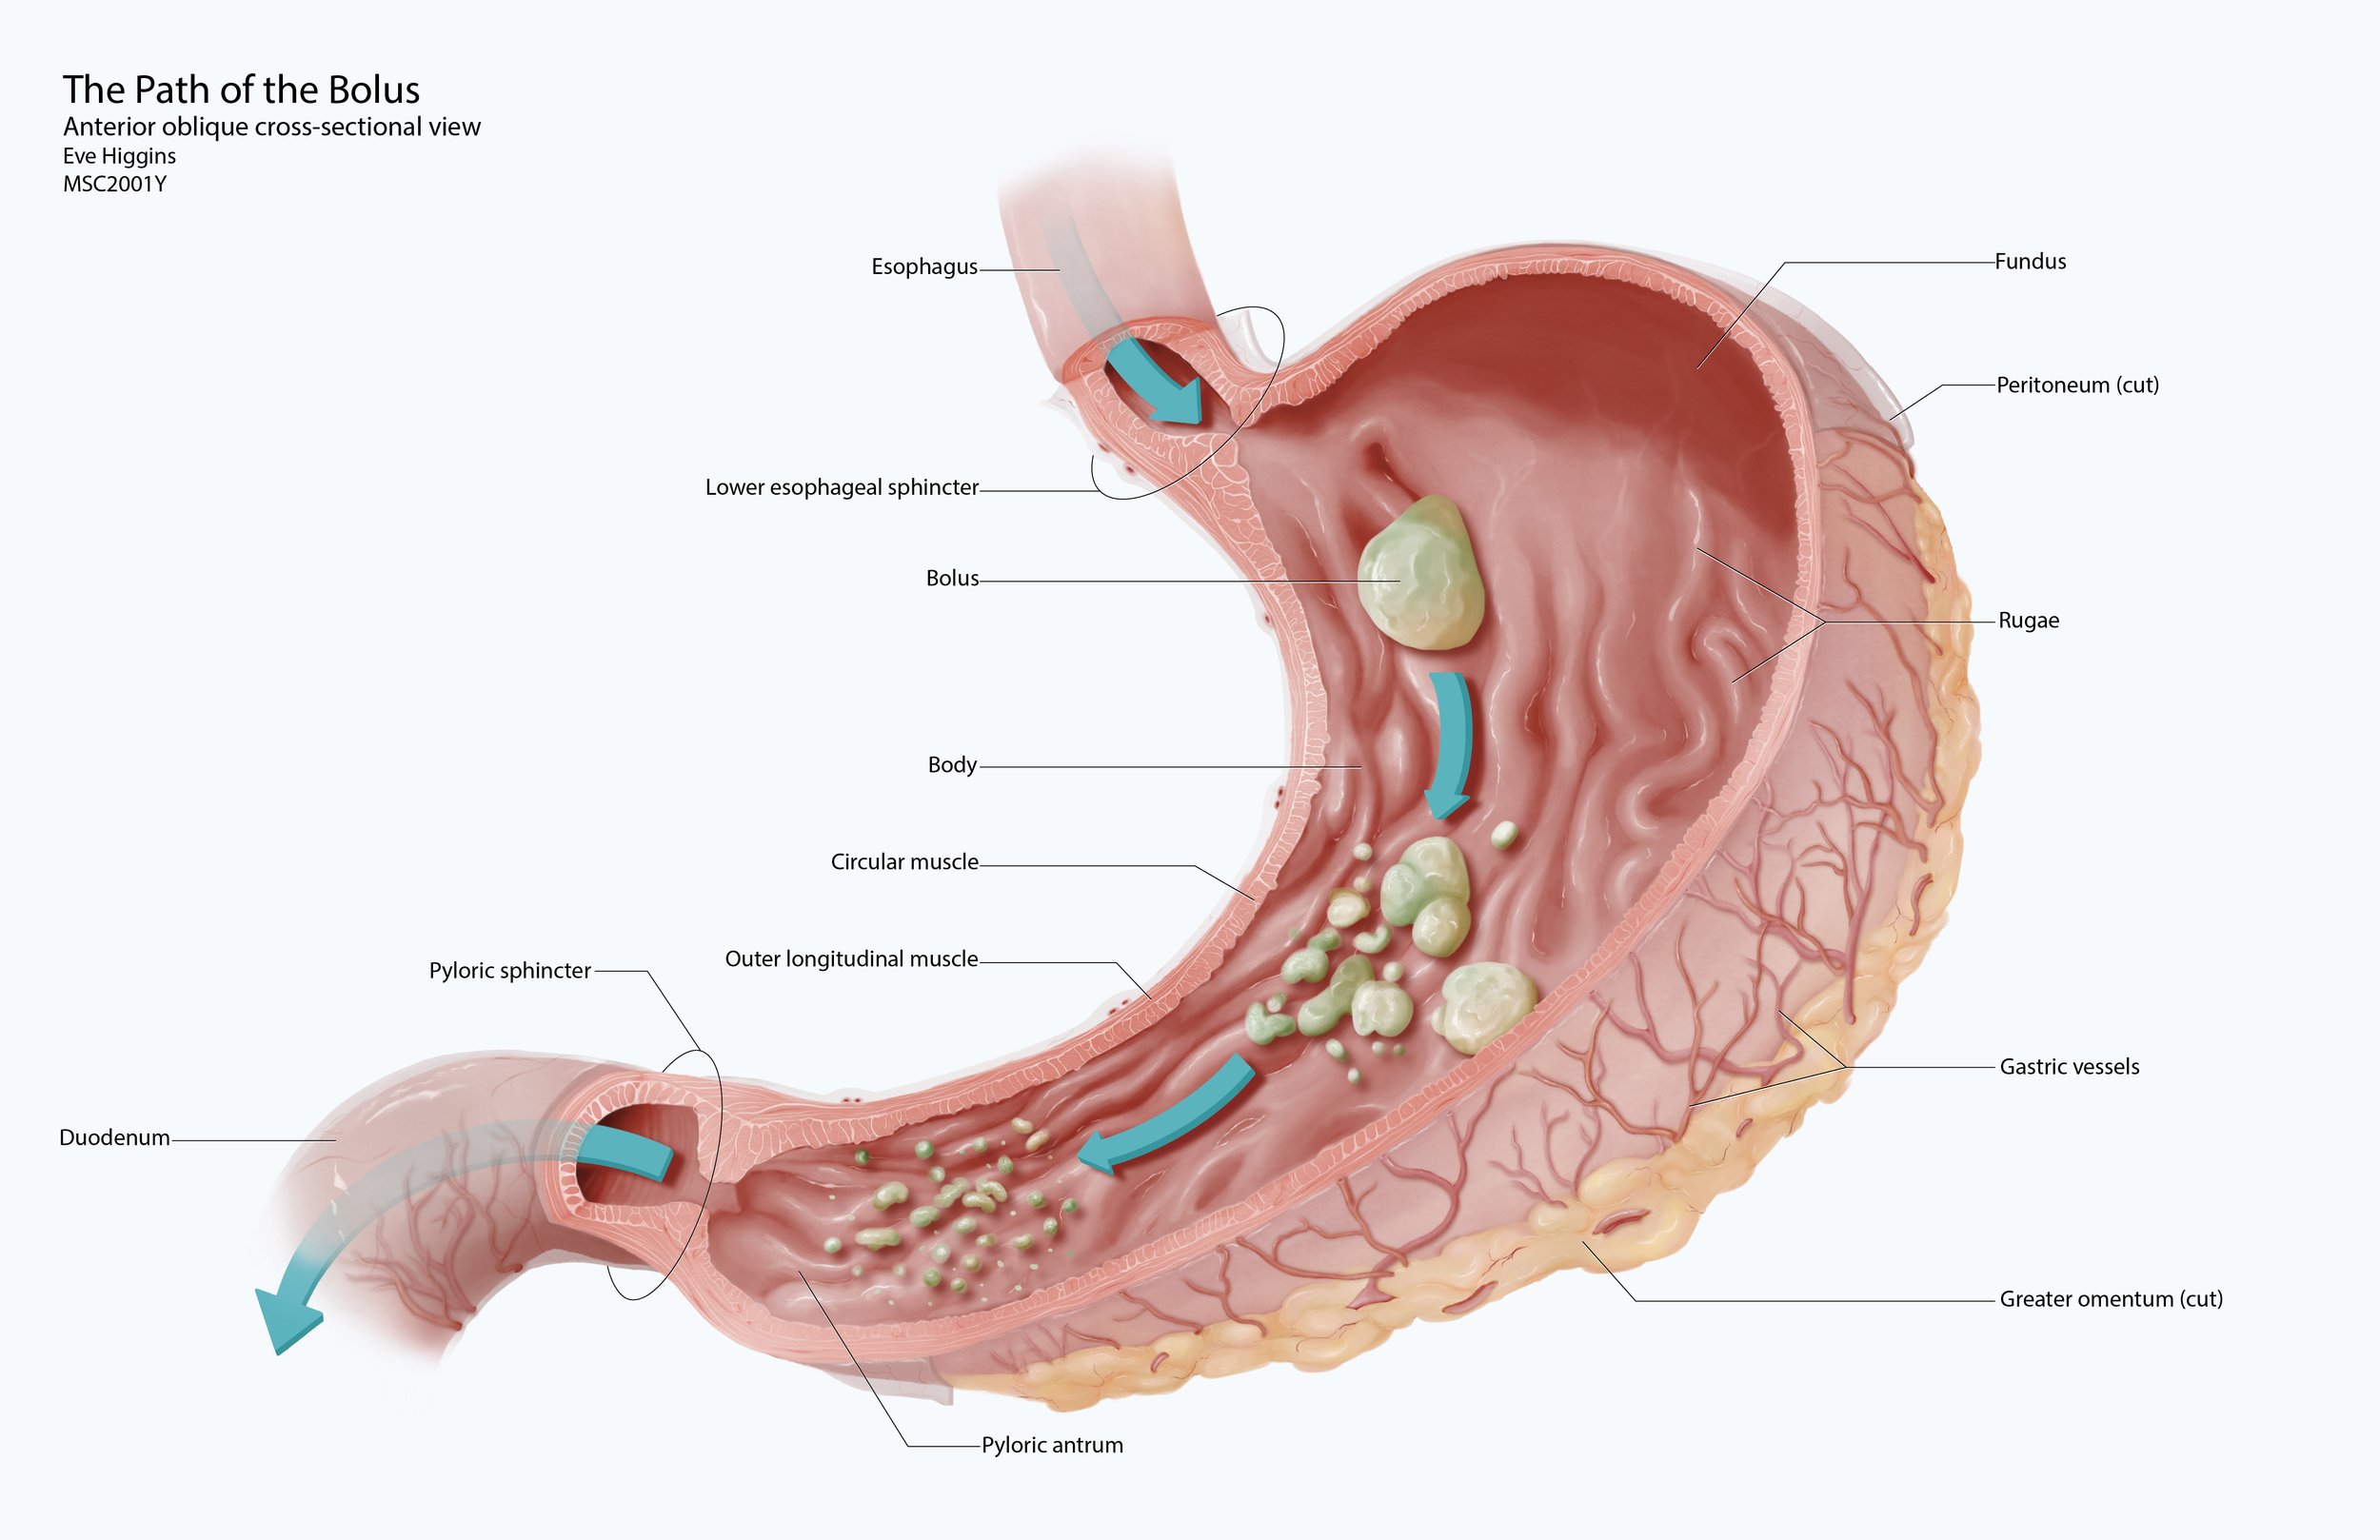
Stomach Cross-section
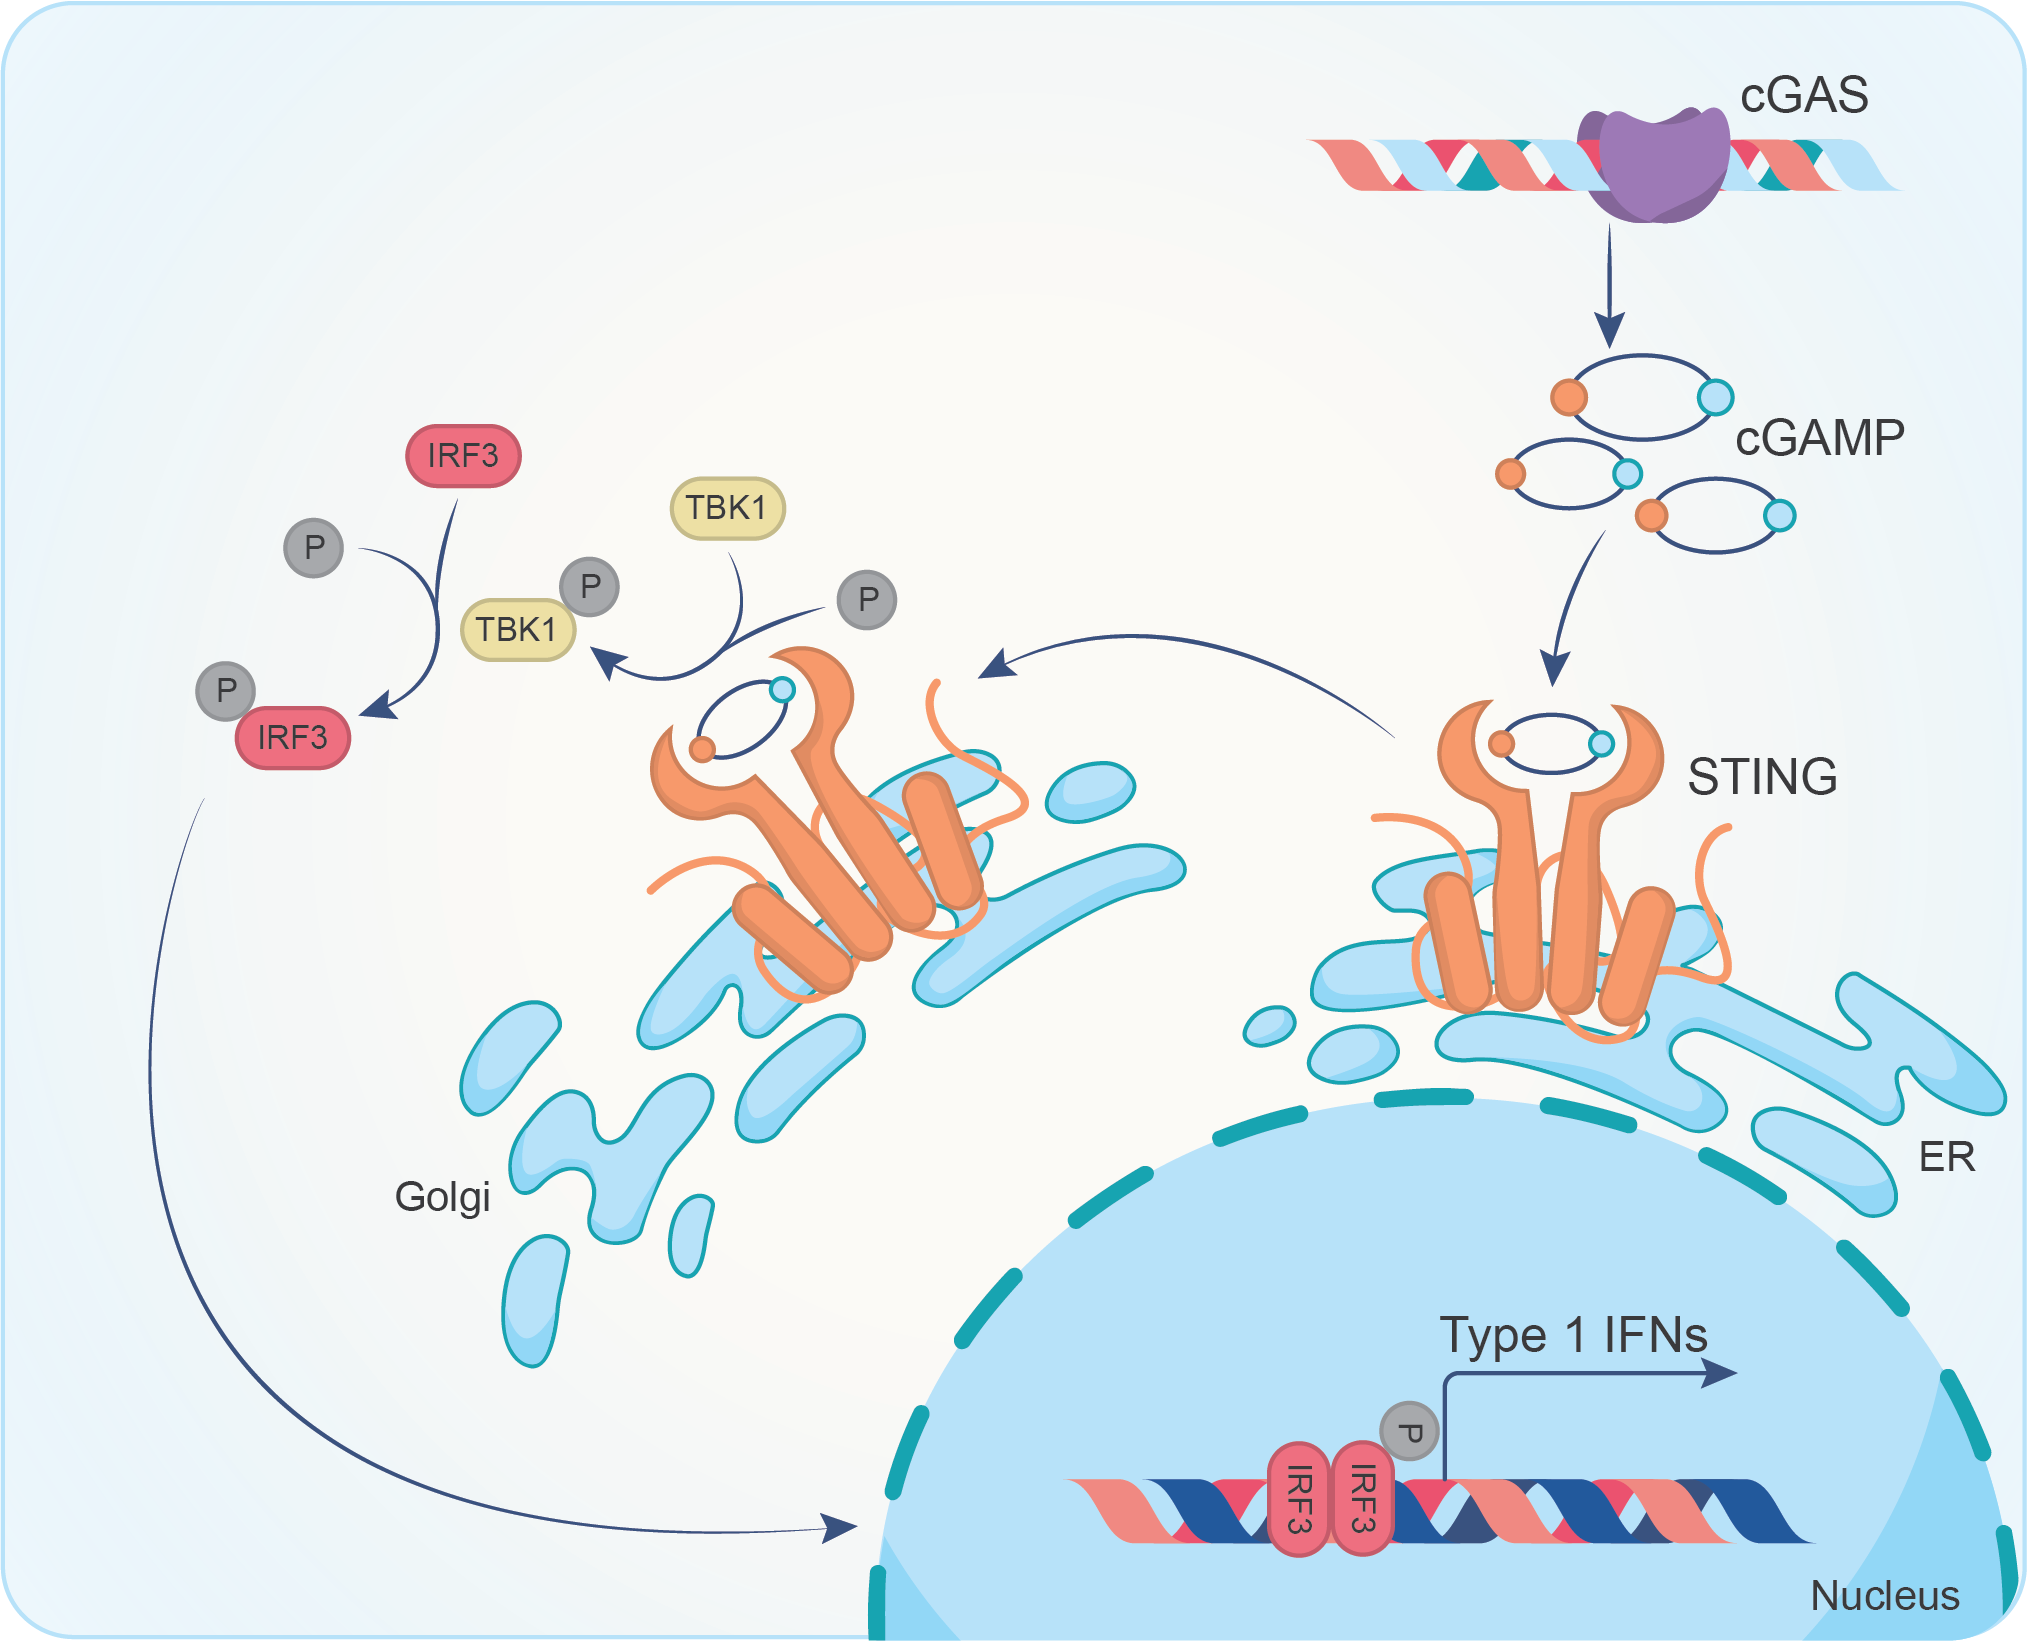
cGAS STING Pathway Visual Designed for Research Presentations

Alpha-Amylase Molecular Visualization

Neuroimmunophysiology of the gastrointestinal tract - Graphical abstract for McKay et al.
BAX/BAK Macropores and Mitochondrial Herniation

Two-Toed Sloth Skull from CT Data